

This article picks up on Expense Ratios and BRI Fund Performance published on September 2, 2025, addressing expense ratios and BRI fund performance. Details on benchmark selection and other technical details are available in the free BRI Quarterly Newsletter (Appendix A of the newsletter contains selected benchmarks). Recall when evaluating equity mutual funds and exchange traded funds (ETFs), expense ratios—the annual fees taken out of fund assets—are among the most scrutinized metrics. Biblically Responsible Investor (BRI) funds are no exception.
In the prior article, two conclusions were drawn: First, like the general academic evidence, the BRI funds exhibit the pattern of higher expense ratio funds having lower alpha on average. The quintile correlations range from –0.60 to –0.39 and the fund correlations range from –0.22 to –0.04. Thus, the BRI community should make a concerted effort to lower fees. Second, the BRI funds underperform their benchmark just like other funds (see SPIVA reports) suggesting the BRI community may pursue more passive indexed but BRI consistent strategies (an interesting application of this pursuit can be seen in PTL, an Inspire Investing product).
Here we investigate another source of potential problems with higher expense ratios—active risk. Dispersion or tracking error is the difference between the holding period return of a particular actively managed instrument less the appropriate passively managed instrument or benchmark. Thus, active risk (also known as dispersion risk or tracking error volatility) is the time series standard deviation of dispersion of a single instrument over time. Passively managed index funds would be expected to have lower active risk when compared with actively managed funds. We explore first the investment analytics and then turn to BRI fund performance.
Your Fund’s “Wiggle” and “Wow”: Tracking Error and Alpha
If you’ve ever checked your ETF or mutual fund and thought, “Huh, I own the S&P-ish thing… so why don’t my results look exactly like the S&P 500?”, congratulations—you’ve discovered the two characters that quietly drive fund behavior: tracking error and alpha. Think of them as the fund’s wiggle (how much it wanders from the benchmark) and wow (how much it tends to beat or lag the benchmark on average).
Let’s translate the finance-speak into English—and maybe a smile.
Two Numbers, One Story
1. Benchmark: The yardstick. For many U.S. stock funds, it’s the S&P 500. It could also be a small-cap index, a bond index, or a global basket. Here, each BRI fund is paired with a passive index fund that corresponds to the Morningstar® classification as reported in Yahoo!Finance. Again, see Appendix A of the BRI Quarterly Newsletter.
2. Active return: What your fund did minus what the benchmark did over the same period. If the S&P gained 1% and your fund gained 1.3%, the active return is +0.3% or +30 basis points.
3. Tracking error (historical): How bouncy those active returns have been. It’s the statistical way of saying, “Over time, how much does this fund wiggle around its benchmark?”
4. Alpha (historical): The average of those active returns. Positive alpha means the fund, on average, added value over the benchmark; negative alpha means it lagged. As previously covered, the vast majority of active funds fail to outperform appropriate benchmarks.
If the benchmark is the posted highway speed, alpha says whether you usually drove a bit faster or slower. Tracking error says how much your speedometer swung around that number.
What Makes Funds Wander (a.k.a., Causes of Tracking Error)
1) Concentration. Indexes are big, diversified behemoths. If your fund holds a fraction of those names—especially in chunky positions—its results naturally wiggle more versus the index. Fewer very large eggs, bigger omelet, more chance you taste the pepper.
2) Style and sector tilts. More small-cap than the index? A bias toward value or momentum? Overweight energy, underweight tech? These tilts create consistent differences. When that style is in favor, you’ll cheer. When it’s not, you’ll practice patience (or creative muttering).
3) Benchmark mismatch. Comparing a global fund to a U.S. benchmark is like checking your steps with someone else’s smartwatch. The mismatch inflates tracking error and confuses the alpha conversation. First rule of benchmarking: use the right yardstick. The key is to use an available passive index fund that aligns with what the fund actually does, not necessarily what they say they do.
4) Market “spread.” In some periods, stocks move roughly together; in others they scatter like cats at bath time. The more spread there is across stocks, the more a fund’s specific choices show up as tracking error.
5) Cash and flows. Funds hold cash to handle redemptions or while trading. Your benchmark is fully invested. In rising markets, cash can make the fund trail; in falling markets, it cushions the blow. Either way, you’ll see a little benchmark gap.
6) Rebalancing choices and trading frictions. Indexes reset on schedules; funds may do it differently to keep costs down. Those timing differences (and small trading costs) show up as tracking error. It’s like trying to merge exactly when the GPS says—traffic has other plans.
7) Derivatives and overlays. Futures, swaps, and currency hedges are routine. They’re precise but not perfect, and small pricing gaps can nudge returns away from the benchmark.
8) Liquidity and pricing quirks. Hard-to-trade securities or different closing times across markets (hello, international funds) can add noise day to day. Don’t panic over short-term wiggles; look at multi-month or multi-year patterns.
The Bottom Line
You don’t need a PhD to judge a fund; you just need to separate wiggle from wow. Tracking error tells you how different the ride is. Alpha tells you whether different has helped or how bad it hurt. Put them together, make sure the benchmark is right, and pick funds whose differences you actually want—and can live with—when the market mood swings.
And remember in investing, “boring on purpose” beats “exciting by accident.”
How Do BRI Funds Perform?
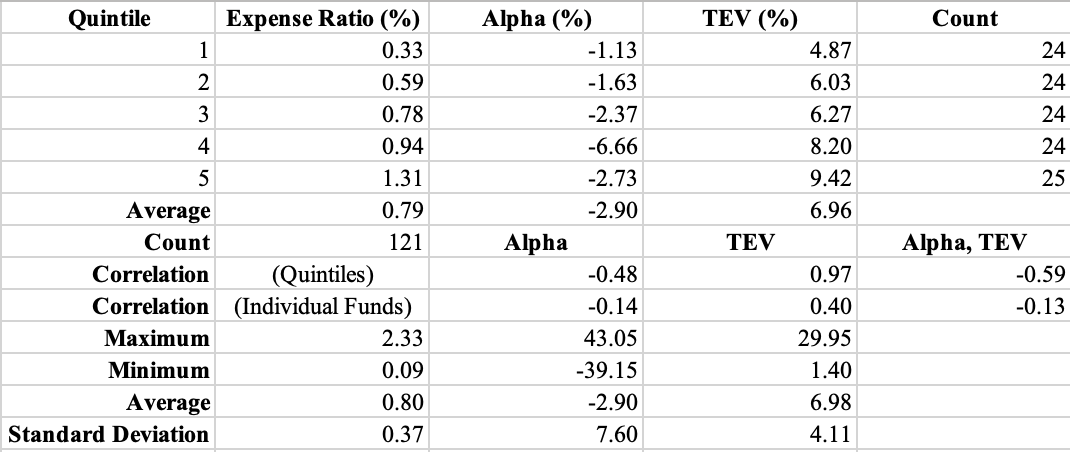
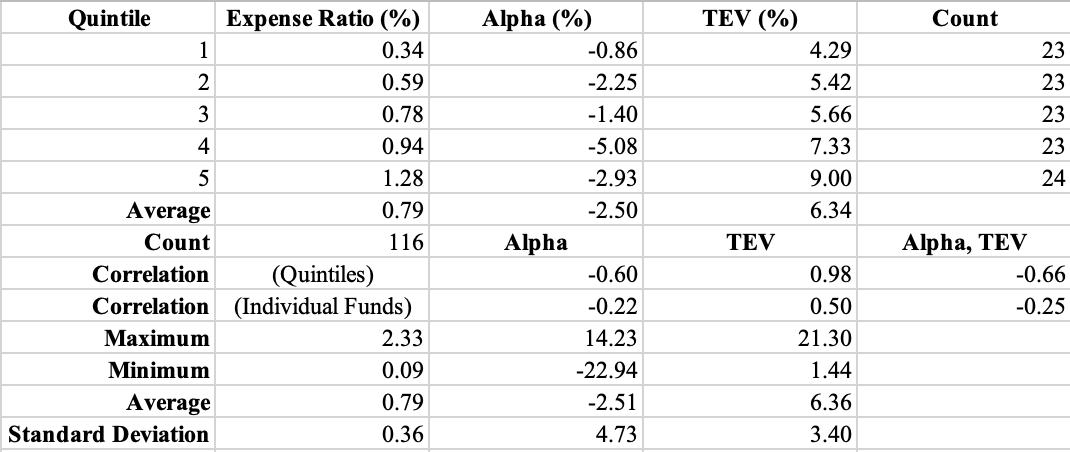
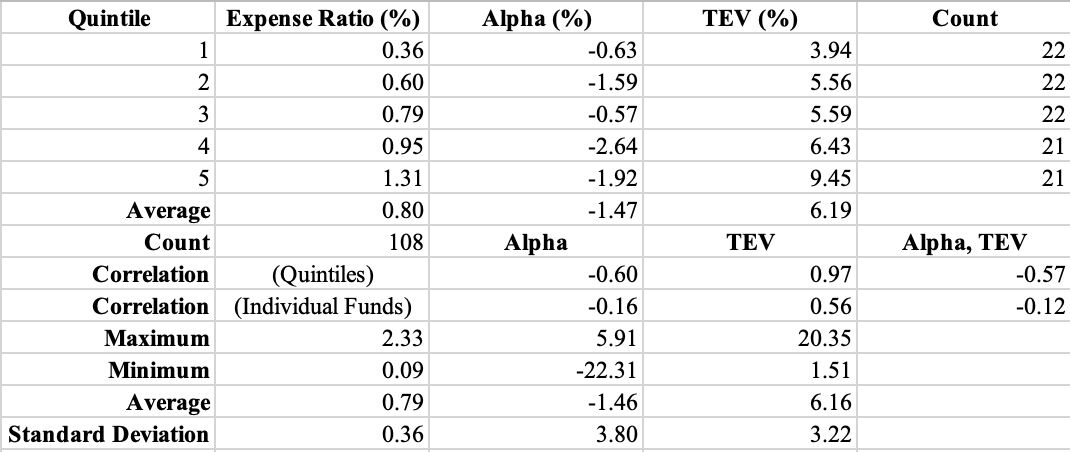
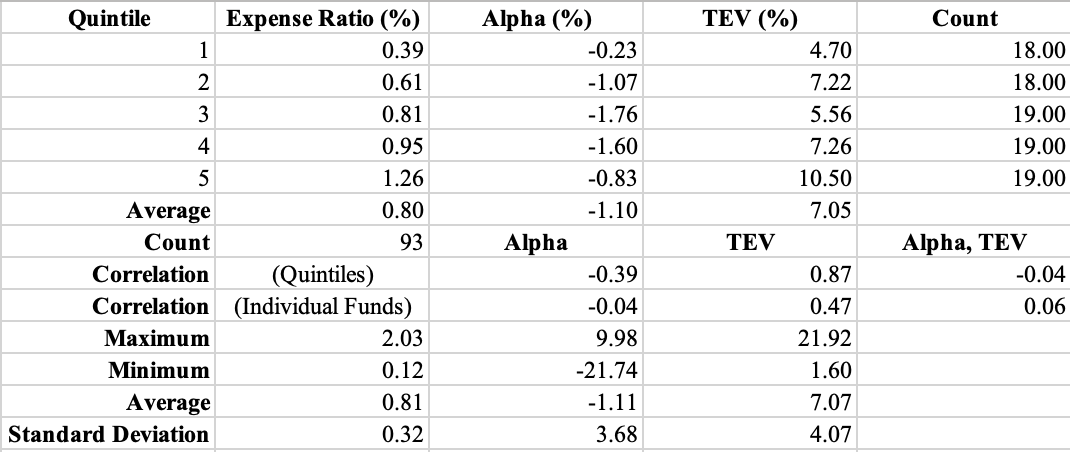
The following tables show aggregate BRI fund performance based on expense ratio quintile. The expense ratio used for mutual funds is the institutional class, thus smaller clients pay even more. The expense ratios are from the last quarter’s fact sheets, not the beginning of the holding periods. Most likely, these expense ratios have not changed dramatically. Longer holding periods have fewer funds reflecting the launch of new funds over this period. Alpha measures the annualized (arithmetic) average return of the fund when compared with the selected benchmark for that fund. Although not monotonic, the pattern is clear: The higher the expense ratio, the lower the alpha and the higher the tracking error volatility (TEV).
One Year Holding Period (8/13/24-8/13/25)
Two Year Holding Period (8/13/23-8/13/25)
Three Year Holding Period (8/13/22-8/13/25)
Four Year Holding Period (8/13/21-8/13/25)
Five Year Holding Period (8/13/20-8/13/25)
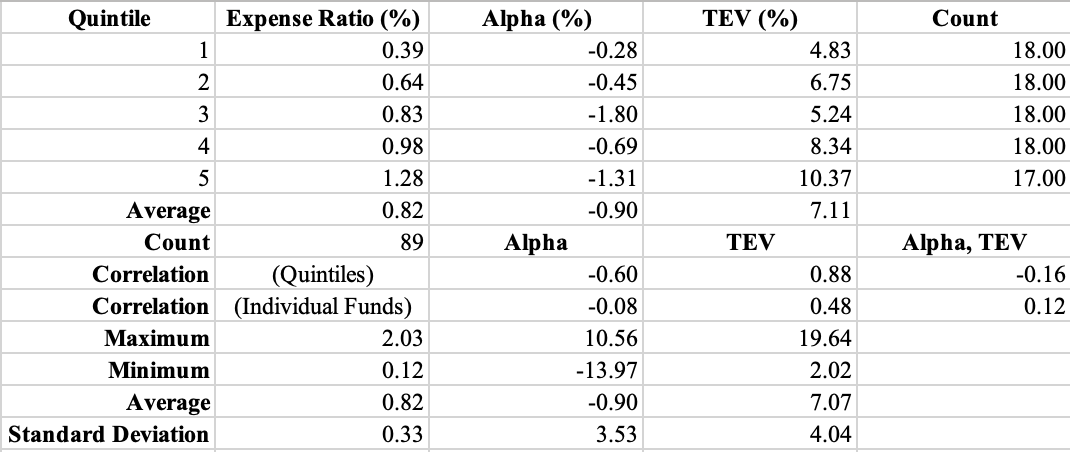
Conclusion: We focus here on three insights that can be gleaned from this evidence. First, as previously covered, the BRI funds exhibit the same pattern of higher expense ratio funds having lower alpha on average and BRI funds underperform like secular funds. Second, tracking error volatility (TEV) has an extremely high positive correlation with the expense ratios. This result is intuitive as more active funds tend to charge higher fees, and one would expect the fund not to be a closet indexer. Third, though not as strong, the higher the alpha, the lower the TEV. The likely channel is more active managers cause higher TEV, and their efforts are not rewarded; hence, lower alpha results.
Thanks, Jake. From my perspective, the BRI investor community is longing for the emergence of BRI version of institutional grade BRI compliant passive index family of funds. We will see how this industry matures.
Thanks for this. My research showed the same thing - BRI funds have not been immune to the performance challenges any other active funds face. Some underperformance is simply due to high expense ratios (like you point out) and some is due to their active share (it's still hard to beat the market).